Credit Suisse: Global Wealth decreased in 2015 on 5.0%
06:00 PM 10/13/2015
Credit Suisse published its annual Global Wealth Report 2015. What does it tell about changes in global wealth, its distribution among countries and population groups and location of the most wealthy people?
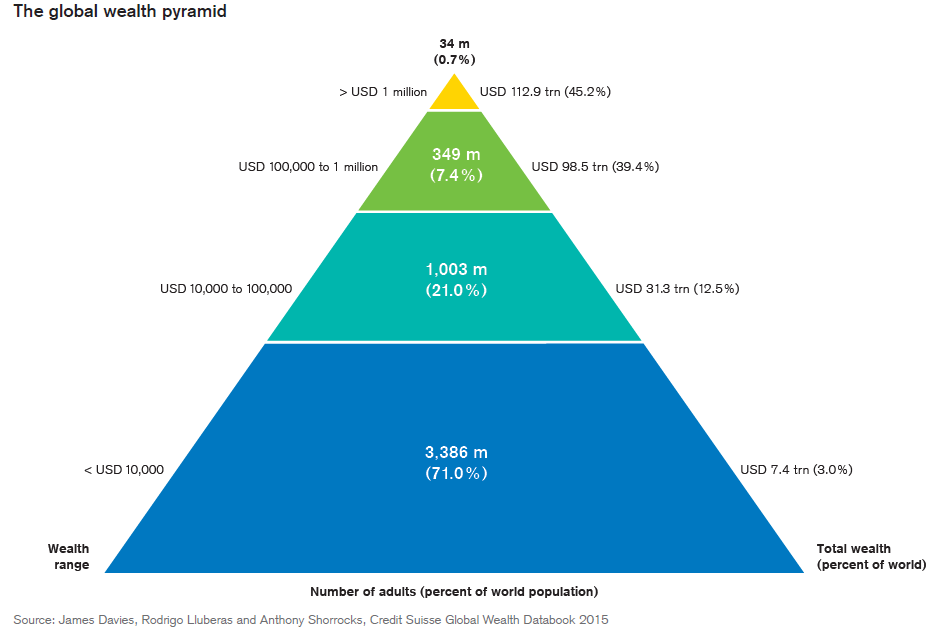
There are 34 mln. Millionaires wordwide and 383 mln. adults with at least $100 th. in wealth. Here is how global wealth pyramid looks like:
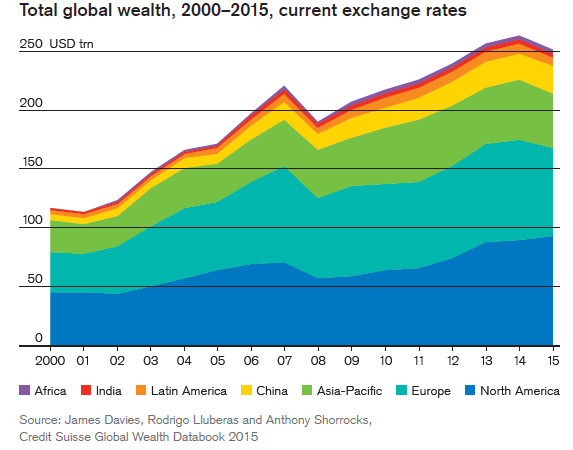
Global Wealth decreased in 2015 on 5.0% mostly due to devaluations of many currencies against the dollar. At the same time global wealth is already higher than in pre-crisis 2007.
Credit Suisse forecasts that “wealth is set to continue its upward trajectory and could grow at an annual rate of 6.6% (including inflation), reaching USD 345 trillion in 2020. This is below last year’s projection of 7%, but not outside historical norms.”
China is expected to become home for the highest number of wealthy people. At the same time we don’t present any specific data about wealth growth forecasts in China as its GDP growth and the prospects of Chinese economy are very uncertain at the moment.
There are 95 mln. adults with wealth more than $100 th. in the US (returnseekers.com target audience) and 15,7 mln. Millionaires.
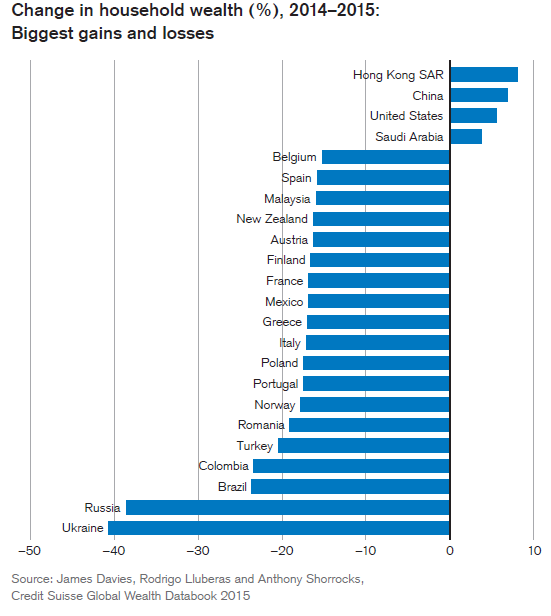
Ukraine and Russia were the countries which lost the biggest shares of their wealth since mid 2014: Russia due to oil price drop and consequent currency devaluation and Ukraine due to political instability and war.
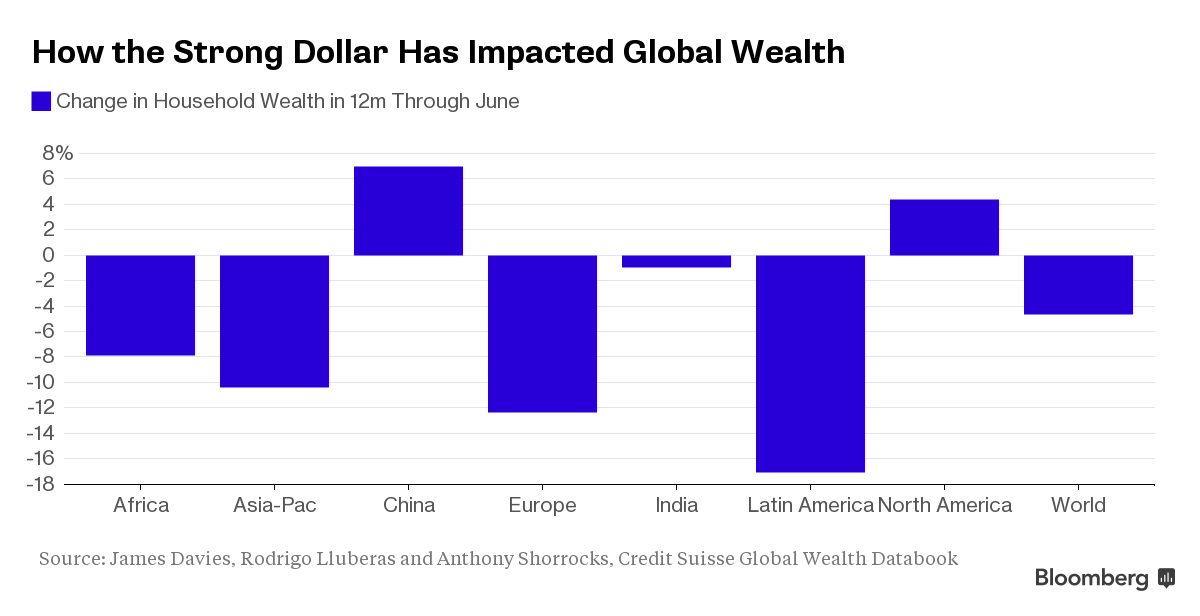
If the same analysis is done per region, it becomes clear that all the countries are down vs. North America except China. This raises the question when would China devalue RMB to return its competitiveness against the rest of the world?
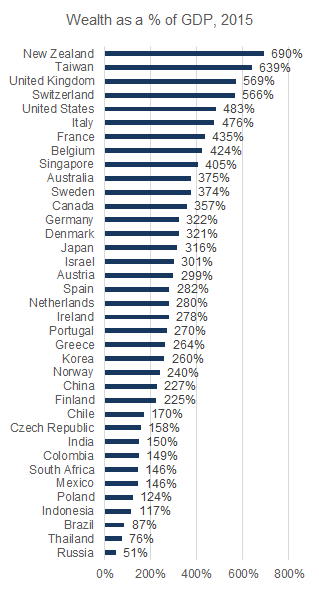
Wealth as a share of GPD measures ability of a nation to accumulate wealth over years and generations. Not surprisingly US is number 5. Above and New Zeeland and Switzerland which also avoided 2nd World War, Taiwan which attracted rich Chinese and UK which attracts rich from Europe, Russia, Middle East and India.
US has one of the least equal wealth distributions: its number 3 among 40 biggest countries. Wealth and income inequality are usually measured by Gini coefficient which takes values from 0 to 1. The higher is Gini coefficient the more wealth is concentrated in a limited group of countries’ population. So Russia has 0.912, Denmark 0.893, US 0.85. As examples among developed could be used European counties: Germany has 0.775 and France has 0.703.